
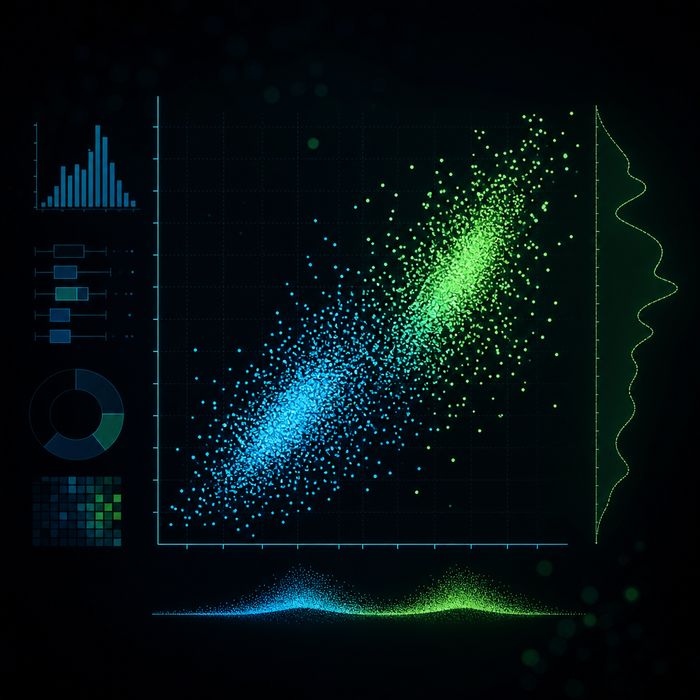
Before any model, before any dashboard, comes exploratory data analysis — the unglamorous, essential work of actually understanding your data. Skip it and you build on sand. This guide covers a practical EDA workflow with pandas and seaborn that surfaces problems and insights fast.
First contact
import pandas as pd
df = pd.read_csv("data.csv")
df.shape        # rows, cols
df.head()       # eyeball the data
df.info()       # dtypes + null counts
df.describe()   # numeric summary
These four lines tell you the size, structure, types and obvious gaps in seconds. Always run them first.
Find the missing and the weird
Quantify missingness with df.isna().mean().sort_values() — a column that's 90% empty is a very different problem from one that's 2% empty. Check dtypes: numbers stored as strings, dates as objects, and unexpected categoricals all hide here.
EDA is detective work. Every anomaly is a clue about how the data was collected — and what you can trust.
Distributions before relationships
Understand each variable alone before pairing them. Histograms and box plots reveal skew, outliers and multi-modality:
import seaborn as sns
sns.histplot(df["price"], kde=True)
sns.boxplot(x=df["price"])
Heavy skew often calls for a log transform; clear outliers deserve investigation, not automatic deletion.
Then relationships
Now look at how variables move together. A correlation heatmap gives the numeric overview; scatter and pair plots show the shape:
sns.heatmap(df.corr(numeric_only=True), annot=True)
sns.scatterplot(data=df, x="area", y="price", hue="type")
Watch for non-linear patterns a single correlation number will miss entirely.
Tell the story
EDA isn't just for you. Turn your two or three most important findings into clean, labelled charts you could drop into a report. If you can't explain what the data says in three plots, you haven't finished exploring.
Wrap up
A disciplined EDA pass saves you from modelling garbage and often answers the business question before any model is trained. Profile, clean, understand distributions, then relationships, then communicate. Every good analysis starts here.